Process capability is a one of six sigma tool to measure process variations in more precise way. Process capability helps to provide overall idea of how process quality is performed with respect to customer specifications limit or deviation with the standard values. This tool also very helpful to measure capability of process or equipment to produce quality products. Now a day’s in a competitive market fulfil customer requirement is very essential.
In this article we learn how to measure process capability in operational process with the help of data collection, data analysis, calculation of process capability, process capability index and practical examples to understand process capability in industries.
Content
• Assumption of process capability study.
• Formula to calculate process capability and process capability index.
• How to measure data is normally distributed?
• Practical examples to understand process capability study.
What are the assumption in process capability study?
- Collected data is normally distributed and process is within statistical quality control level.
- No special cause availability within the operational process.
Formulas to measure process capability
There are two different functions or areas to focused process capability study. The very first part is process capability measure the process variations and second part is actual process variations is compare with customer specifications limit.

How to measure data is normally distributed?
There are several methods to verify data collection is normally distributed or not so, based on we can proceed to applied process capability study in operational processes. Review below attached methods to verify data is normally distributed.
- Histogram.
- Box plot.
- QQ plot.
- Kolmogorov smirnov test
- Lilliefors test
- Shapiro wilk test
To verify data is normally distributed generally histogram, box plot and QQ plot is widely used.
Practical example of process capability study.
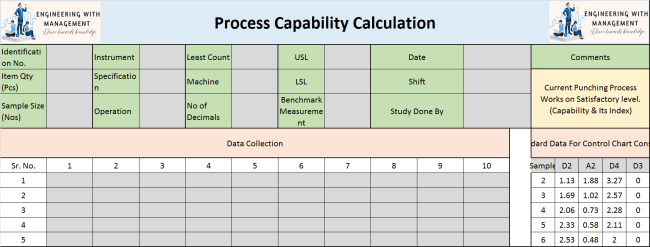
One of the manufacturing units measures the product dimension with the help of dimension measuring instrument Vernier calipers. Management requirement is to measure process variations with the help product dimensions’ data. They are collect data in a 10 samples. The outcomes required is to calculation of process capability and process capability index.
Review below attached samples of data to be collected.

As per attached data is already normally distributed. Now the very important step is check any special variations available within the data with the help of x bar and r chart of statistical quality control.
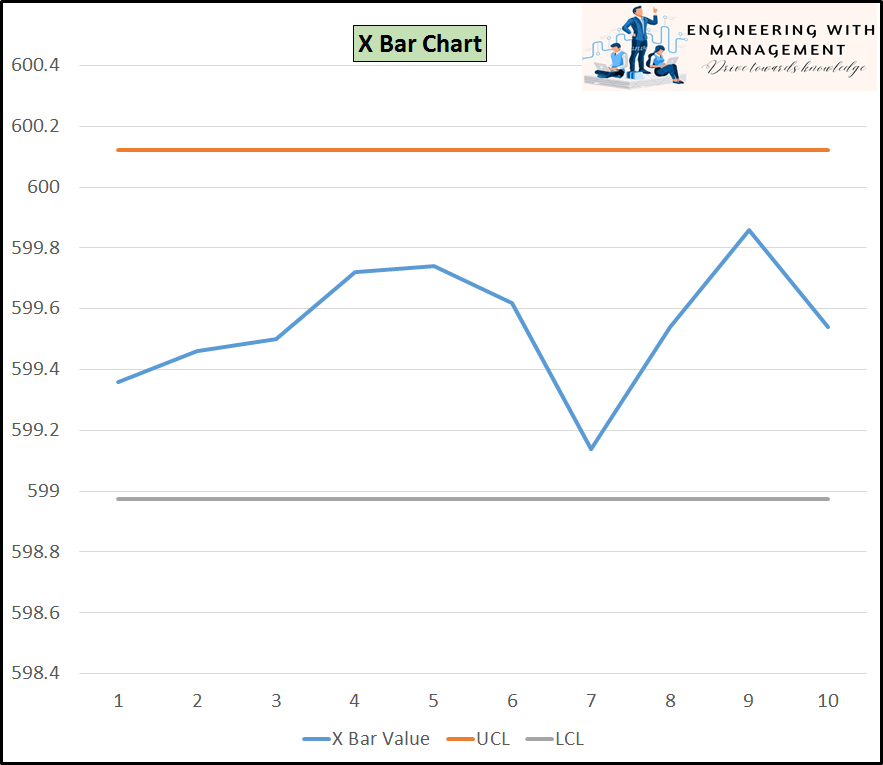
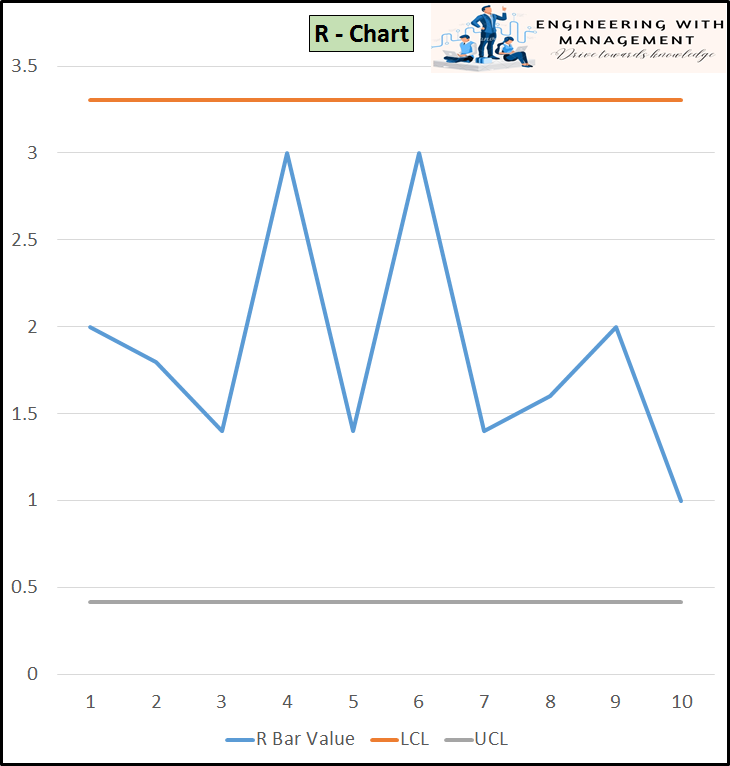
As per attached above chart all the data points are shown as per within control limit so we can proceed to check process variations with the help of process capability study.
Now for the detail calculation of process capability I developed master excel sheet and attached all the formulas with 5 samples size and 10 sample size as per industries requirement. If you enter normally distributed data in attached excel sheet, calculation of process capability and process capability index done within few seconds. Download below attached excel template for your reference.
Review the master template attached in excel sheet and refer the below attached user input window for process capability and process capability calculations. Attached black color is for user input. Top window is basically basic information of product and process detail. the very important part of top window is without fail mention USL and LSL as per customer requirement. In data collection tab paste data collected.